|
One of the all-time-great pieces of samizdat literature in economics is a paper written by John Campbell of Harvard and Robert Shiller of Yale for a private briefing of Chairman Alan Greenspan and the other members of the Federal Reserve Board, exactly twelve years ago (in November of 1996).1 Campbell and Shiller’s question was whether the stock market had entered a bubble phase; the persuasiveness of their answer can be judged by the fact that Chairman Greenspan gave his famous speech about “irrational exuberance” less than a month later.
The extraordinary recent declines in the stock market make this an opportune moment to reassess Campbell and Shiller’s contribution and to ask what their method might suggest about future stock returns starting from today. Their model’s answer is that the recent market declines reflect the elimination of the last vestiges of the irrational exuberance that Alan Greenspan worried about in 1996. But the Campbell-Shiller framework does not support the increasingly common view that the market has overshot on the down side; instead, it says that stock prices now are at a level that looks about right (if history is any guide).
Campbell and Shiller’s method and message were as simple as any stock market analysis ever published. They argued that among the countless statistics that have been proposed as forecasters of stock returns, the ratio of price to earnings has special pride of place as being both the most venerable measure, and the one most closely tied to economic theory. They advocated, in particular, a version of the P/E ratio proposed by Warren Buffett’s idol, legendary investor Benjamin Graham (along with coauthor David Dodd) in 1934: The ratio of stock prices to a ten-year average of lagged earnings (according to Graham and Dodd, averaging was necessary to smooth out transitory fluctuations in profitability).
The message from Campbell and Shiller was that in periods when the “Graham ratio” (as Shiller subsequently dubbed it) was high, stock returns over the following decade had been consistently low; when the Graham P/E ratio had been low, subsequent returns had been good.
At the time of their writing, the Graham ratio was flashing bright red; it was at its second-highest value in the 110 year history of the data that Campbell and Shiller had compiled (they produced data back to 1872 by splicing together the S&P composite index with earlier indices from the Cowles commission and other sources).
Of course, their warning was a bit premature; the Graham ratio would scale even more dizzying heights in the next four years before the 1990s boom ended. But from today’s perspective, their forecast (and Shiller (2000)’s subsequent warnings in his book Irrational Exuberance) are eerily prescient. I present here an updated version of the key Campbell and Shiller figure, with only a small tweak: I have modified the forecasting interval to 12 years, since we are now almost exactly 12 years out from the original date of the Campbell and Shiller paper.2 (A 12 year period arguably makes more sense anyway, as 12 years is the smallest common multiple of the terms of members of the House (2 years), Senate (6 years), and the President (4 years), and so it aligns better with any potential political business cycle.)
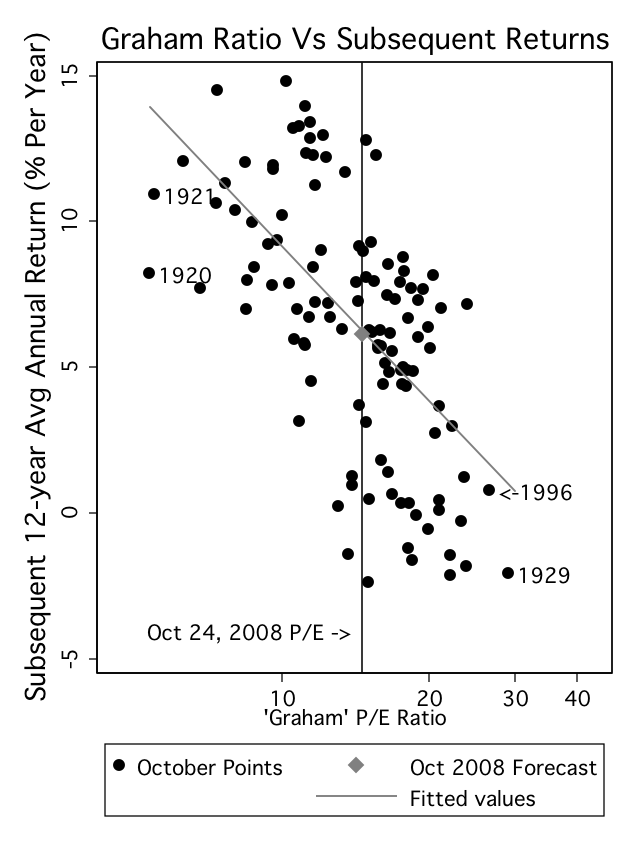
Figure 1 shows a plot of the data for 12 year periods that span the available history, along with a vertical line showing the Graham P/E ratio using the closing value of the S&P index from October 24, 2008. The downward-sloping line in the figure shows the regression line that provides the best statistical fit of the historical data.3
The data point that corresponds to October of 1996 (12 years ago) is specially highlighted; in the entire historical sample, only October of 1929 exhibited a (barely) higher Graham ratio.
The height of the 1996 datapoint reflects the average market returns from November of 1996 to the present moment. This data point is remarkably close to the fitted regression line; that is, the forecast that would have been produced by their model at the time Campbell and Shiller spoke to the Fed matches extraordinarily well with the actual returns the market has yielded until now.
Some market commentators argue that the recent stock price declines reflect a degree of irrational pessimism or panic that is the inverse of the irrational exuberance of the 1990s. The Campbell and Shiller figure provides no support for that view; the vertical line reflecting the Graham P/E ratio in late October is right around the middle of historical experience, not on the far left end. The intersection of that line with the regression forecast indicates that historical experience would lead one to forecast a historically average return on equities over the next 12 years of about 6 percent or so per year (net of inflation).